In today’s world of microservices and distributed systems, understanding the flow of requests across multiple components is crucial for maintaining application performance and reliability. An open-source observability framework called OpenTelemetry has emerged as a powerful tool to address this challenge, providing a standard way to collect, process, and export telemetry data. In this article, I will guide you through the fundamentals of OpenTelemetry, its components, and how to get started with implementing tracing in your ASP.NET Core applications. By the end, you’ll have the knowledge to configure OpenTelemetry and visualize traces using tools like Jaeger.
Table of Contents
What is Tracing?
Tracing is a process of tracking the flow of requests or operations within an application. Tracing helps us monitor how a user request travels through multiple components of the application and reveals the underlying sequence of events. Modern applications normally distribute responsibilities across multiple services and in these systems, the tracing becomes an invaluable resource for enhancing observability.
What is Distributed Tracing?
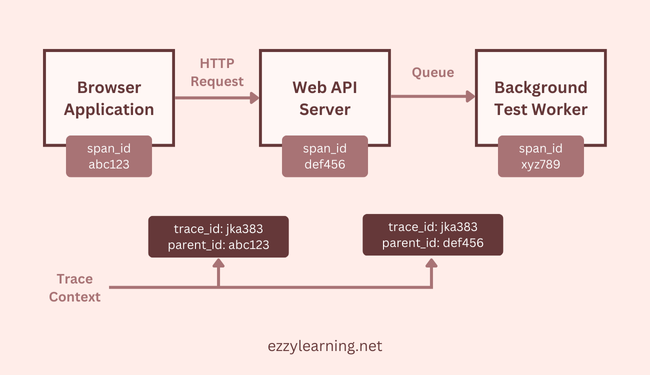
Distributed tracing is an extension of traditional tracing, designed specifically for systems composed of multiple interconnected services. In modern architectures, such as microservices or cloud-based applications, a single user request can span several services, databases, and third-party APIs. Distributed tracing helps track the journey of these requests across all components, providing a comprehensive view of how they interact.
Distributed tracing relies on:
- Trace Context Propagation – A unique identifier is assigned to each request and passed along as it moves through different services. This identifier ties together all spans related to the same trace.
- Spans Across Services – Each service adds its span to the trace, capturing details about the operation it performs.
Benefits of Distributed Tracing
Distributed tracing provides the following benefits
End-to-End Request Visibility – It helps developers understand the lifecycle of a request, from start to finish, as it moves through the system. It follows a request as it propagates through different services, revealing the entire execution path.
Performance Insights – Tracing highlights how much time is spent in each part of the system, identifying performance issues or inefficiencies. It helps in identifying slow or inefficient operations within the system, enabling targeted performance improvements.
Root Cause Analysis – If an issue occurs, tracing allows you to pinpoint exactly where the failure happened, enabling faster debugging and resolution. Developers can quickly pinpoint issues, whether it’s a slow database query, a misconfigured API, or a service timeout.
Improved Reliability – Provides insights into system behavior, enabling proactive measures to prevent issues and maintain uptime.
Correlation Across Components – Connects logs, metrics, and traces, offering a unified view of system health and performance.
Supports Microservices Architectures – Makes it easier to monitor and manage complex distributed systems.
Facilitates Scalability – Helps teams understand how requests impact system performance, guiding scaling decisions.
Enhances Observability – Complements traditional monitoring tools by providing granular insights into distributed operations.
Dependency Mapping – It highlights how services depend on each other, making it easier to identify critical paths and potential bottlenecks.
What is OpenTelemetry?
OpenTelemetry is an open-source observability framework that provides tools, APIs, and SDKs to simplify the process of instrumenting code to generate telemetry data and to collect and export telemetry data from applications. It provides a comprehensive view of your application, helping you maintain performance, diagnose issues, and deliver a reliable user experience.
At its core, OpenTelemetry provides the following benefits:
Standardized Observability – OpenTelemetry follows industry standards, ensuring interoperability across tools and platforms.
Broad Language Support – It supports multiple programming languages, including .NET, Java, Python, and JavaScript.
Future-Proofing – Being an open-source project, it evolves with community-driven innovation, making it a reliable choice for long-term observability strategies.
Vendor-Neutral – It is also vendor-neutral, meaning you can integrate it with a wide range of backend systems like Jaeger, Prometheus, or Elastic, without being locked into a specific solution.
Key Components of OpenTelemetry
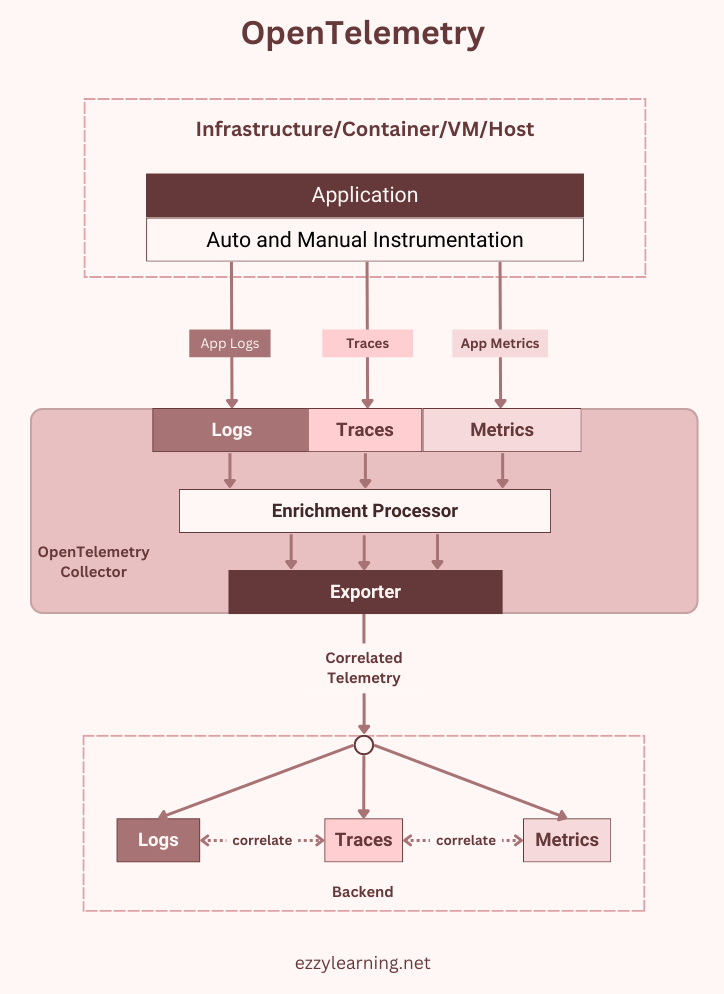
OpenTelemetry is built on three primary components traces, metrics, and logs. Each of these components handles different types of telemetry data and addresses a different aspect of observability.
Traces
Traces capture the end-to-end journey of requests as they travel through various services and operations in an application. They help developers understand the flow of requests, identify bottlenecks, and detect errors by breaking down the request lifecycle into smaller units called spans. For example, a trace can show how an HTTP request moves from a frontend service to the backend and then to a database, providing granular insights into each step.
Metrics
Metrics offer a high-level view of an application’s performance and health by aggregating numerical data over time. Common metrics include CPU usage, memory consumption, request rates, and error counts. Metrics are invaluable for detecting trends, monitoring resource utilization, and setting up alerts for abnormal behavior. For instance, tracking the average response time of an API can reveal performance degradation before it impacts users.
Logs
Logs provide detailed, event-specific information that complements traces and metrics. They are particularly useful for debugging and capturing contextual details about application behavior. For example, logs can record error messages or warnings when a database query fails, offering deeper insights into the root cause of issues.
Configuring OpenTelemetry in ASP.NET Core
OpenTelemetry offers out-of-the-box support for ASP.NET Core components like incoming and outgoing HTTP requests, SQL queries, gRPC calls, etc. It provides a set of client libraries that instruments our .NET applications and emits traces, which we can then send to an observability back-end. Some of these libraries also provide an auto-instrumentation feature that makes it very easy to configure OpenTelemetry in .NET applications.
Let’s create an ASP.NET Core Web API project using .NET 8 and make sure the default /WeatherForecast controller is working as expected.
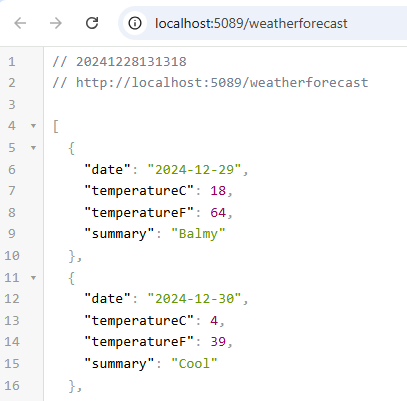
By default, ASP.NET Core will log the following information in the console window.
info: Microsoft.Hosting.Lifetime[14]
      Now listening on: http://localhost:5089
info: Microsoft.Hosting.Lifetime[0]
      Application started. Press Ctrl+C to shut down.
info: Microsoft.Hosting.Lifetime[0]
      Hosting environment: Development
info: Microsoft.Hosting.Lifetime[0]
To configure auto-instrumentation we need to install the following necessary Nuget packages.
- OpenTelemetry.Extensions.Hosting – Provides extension methods for automatically starting (and stopping) OpenTelemetry tracing (TracerProvider) and metrics (MeterProvider) in ASP.NET Core and .NET Generic hosts.
- OpenTelemetry.Instrumentation.AspNetCore – Provides ASP.NET Core instrumentation for OpenTelemetry .NET
- OpenTelemetry.Exporter.Console – Exports telemetry data to the console window.
Trace Incoming HTTP Requests using OpenTelemetry
To trace incoming HTTP requests, we need to configure OpenTelemetry in the Program.cs file as follows.
builder.Services.AddOpenTelemetry()
    .WithTracing(traceBuilder =>
    {
        traceBuilder
            .SetResourceBuilder(ResourceBuilder.CreateDefault().AddService("MyAspNetCoreApi"))
            .AddAspNetCoreInstrumentation()
            .AddConsoleExporter();
    });
Let’s review some of the methods we called above to configure OpenTelemetry.
SetResourceBuilder – This method specifies metadata such as the application name (MyAspNetCoreAPI). You can also specify the service version, service instance id, or service namespace in the AddService method of the ResourceBuilder to provide more information about the service you are tracing.
AddAspNetCoreInstrumentation – This method enables automation data collection of all incoming HTTP requests in ASP.NET Core.
AddConsoleExporter – This method exports the telemetry data to the console for immediate observation.
Let’s run our application and make a request to /WeatherForecast. OpenTelemetry will automatically capture all necessary telemetry data for the incoming HTTP request and then this data will be exported to the console in a readable format, similar to the following:
Activity.TraceId:            11f7e24fff6f223e8019ac7605e4cb22
Activity.SpanId:             56d751b8091412d8
Activity.TraceFlags:         Recorded
Activity.DisplayName:        GET WeatherForecast
Activity.Kind:               Server
Activity.StartTime:          2024-12-28T08:32:56.3140268Z
Activity.Duration:           00:00:01.1532180
Activity.Tags:
    server.address: localhost
    server.port: 5089
    http.request.method: GET
    url.scheme: http
    url.path: /WeatherForecast
    network.protocol.version: 1.1
    user_agent.original: Mozilla/5.0 (Windows NT 10.0; Win64; x64) Chrome/131.0.0.0
    http.route: WeatherForecast
    http.response.status_code: 200
Instrumentation scope (ActivitySource):
    Name: Microsoft.AspNetCore
Resource associated with Activity:
    service.name: MyAspNetCoreApi
    service.instance.id: 532a6a28-73eb-4b5f-8877-4fbf328cf964
    telemetry.sdk.name: opentelemetry
    telemetry.sdk.language: dotnet
    telemetry.sdk.version: 1.10.0
That’s a lot of information. We can see some important IDs, such as Activity.TraceId and Activity.SpanId. The TraceId property is used to correlate spans so we can view all the events that occurred during a single request. In this case, we only have one, but with multiple downstream events, they would all use the same TraceId. Under the Activity.Tags property heading, we can see more useful information about the incoming request and the server such as server.address, server.port, url.path, etc.
Trace Outgoing HTTP Requests using OpenTelemetry
Most .NET Developers use HttpClient to call external APIs in ASP.NET Core applications. To enable automatic tracing of outgoing requests made using HttpClient, first you need to install OpenTelemetry.Instrumentation.Http Nuget package and then you need to configure tracing by calling the AddHttpClientInstrumentation method in the Program.cs file.
builder.Services.AddOpenTelemetry()
    .WithTracing(traceBuilder =>
    {
        traceBuilder
            .SetResourceBuilder(ResourceBuilder.CreateDefault().AddService("MyAspNetCoreApi"))
            .AddAspNetCoreInstrumentation()
            .AddHttpClientInstrumentation()
            .AddConsoleExporter();
    });
To trace outgoing HTTP requests, let’s create a new endpoint on our existing WeatherForecast controller to make an outgoing HTTP request using HttpClient. We don’t need any advanced logic in this endpoint, we can simply instantiate a new HttpClient and make a GET request to create a trace.
[Route("external")]
[HttpGet]
 public async Task GetExternalApiData()
 {
     var client = new HttpClient();
     var response = await client.GetAsync("https://www.ezzylearning.net");

     response.EnsureSuccessStatusCode();
 }
Now, let’s run our application and make a request to /WeatherForecast/external. You will see a new trace emitted in the console window.
Activity.TraceId:            a04b5922578155563c862c424e077769
Activity.SpanId:             8eef7c6ccb87c133
Activity.TraceFlags:         Recorded
Activity.ParentSpanId:       16f1c3d63d40e4f2
Activity.DisplayName:        GET
Activity.Kind:               Client
Activity.StartTime:          2024-12-28T12:40:07.3758902Z
Activity.Duration:           00:00:01.8469268
Activity.Tags:
    http.request.method: GET
    server.address: www.ezzylearning.net
    server.port: 443
    url.full: https://www.ezzylearning.net/
    network.protocol.version: 1.1
    http.response.status_code: 200
Instrumentation scope (ActivitySource):
    Name: System.Net.Http
Resource associated with Activity:
    service.name: MyAspNetCoreApi
    service.instance.id: 951a7bf6-946a-4049-ac74-e5639d4621d4
    telemetry.sdk.name: opentelemetry
    telemetry.sdk.language: dotnet
    telemetry.sdk.version: 1.10.0
This looks very similar to our previous, incoming HTTP trace but there are a couple of slight differences. First, our ActivitySource tag Name value is generated as HttpClient. Secondly, Activity.Kind has a value of Client this time. This follows the OpenTelemetry trace standards and lets us know this is an outgoing remote call.
Trace SQL Statements using OpenTelemetry
Our applications often require some form of data persistence, and when working with .NET, SQL is usually the database of choice. Fortunately, there is a client library that provides automatic instrumentation and allows us to collect tracing information for SQL client connections.
First, we need to install OpenTelemetry.Instrumentation.SqlClient Nuget package and then we need to configure tracing by calling the AddSqlClientInstrumentation method in the Program.cs file.
builder.Services.AddOpenTelemetry()
    .WithTracing(traceBuilder =>
    {
        traceBuilder
            .SetResourceBuilder(ResourceBuilder.CreateDefault().AddService("MyAspNetCoreApi"))
            .AddAspNetCoreInstrumentation()
            .AddHttpClientInstrumentation()
            .AddSqlClientInstrumentation()
            .AddConsoleExporter();
    });
I won’t cover all the setup required to create a database and configure Entity Framework Core in ASP.NET Core applications but if you are interested, you can read my other posts such as Data Access in ASP.NET Core using EF Core (Database First) and Data Access in ASP.NET Core using EF Core (Code First).
For the purpose of this article, let’s assume you have a database with a Countries table and you want to return the top 5 countries sorted by name so you can write a simple API endpoint like below.
[Route("countries")]
[HttpGet]
public async Task<IEnumerable<dynamic>> GetCountries()
{
    return await _context.Countries
        .Select(x => new
        {
            x.Id,
            x.Name
        })
        .OrderBy(x => x.Name)
        .Take(5)
        .ToListAsync();
}
We are now ready to view the traces for our SQL client. Run the application and make a GET request to /WeatherForecast/Countries and you will see the SQL trace similar to the following in the console window.
Activity.TraceId:            36f3876731d74046bdfe5099b54fe44d
Activity.SpanId:             0fa49a541ffb5f28
Activity.TraceFlags:         Recorded
Activity.ParentSpanId:       a73154970a6d5930
Activity.DisplayName:        BlazingCampaigns
Activity.Kind:               Client
Activity.StartTime:          2024-12-28T14:52:51.9790774Z
Activity.Duration:           00:00:00.0978595
Activity.Tags:
    db.system: mssql
    db.name: MyDatabase
    server.address: HOME-PC
Instrumentation scope (ActivitySource):
    Name: OpenTelemetry.Instrumentation.SqlClient
    Version: 1.10.0-beta.1
Resource associated with Activity:
    service.name: MyAspNetCoreApi
    service.instance.id: 153cde1b-c5f7-45f7-b5b2-1a644cc60c87
    telemetry.sdk.name: opentelemetry
    telemetry.sdk.language: dotnet
    telemetry.sdk.version: 1.10.0

info: Microsoft.EntityFrameworkCore.Database.Command[20101]
      Executed DbCommand (154ms) [Parameters=[@__p_0='?' (DbType = Int32)], CommandType='Text', CommandTimeout='30']
      SELECT TOP(@__p_0) [c].[Id], [c].[Name]
      FROM [app].[Countries] AS [c]
      ORDER BY [c].[Name]

Activity.TraceId:            36f3876731d74046bdfe5099b54fe44d
Activity.SpanId:             a73154970a6d5930
Activity.TraceFlags:         Recorded
Activity.DisplayName:        GET WeatherForecast/countries
Activity.Kind:               Server
Activity.StartTime:          2024-12-28T14:52:49.9326617Z
Activity.Duration:           00:00:02.2515506
Activity.Tags:
    server.address: localhost
    server.port: 5089
    http.request.method: GET
    url.scheme: http
    url.path: /WeatherForecast/countries
    network.protocol.version: 1.1
    user_agent.original: Mozilla/5.0 (Windows NT 10.0; Win64; x64) Chrome/131.0.0.0
    http.route: WeatherForecast/countries
    http.response.status_code: 200
Instrumentation scope (ActivitySource):
    Name: Microsoft.AspNetCore
Resource associated with Activity:
    service.name: MyAspNetCoreApi
    service.instance.id: 153cde1b-c5f7-45f7-b5b2-1a644cc60c87
    telemetry.sdk.name: opentelemetry
    telemetry.sdk.language: dotnet
    telemetry.sdk.version: 1.10.0
You can see that the OpenTelemetry SQL instrumentation library provides us with some handy information, such as the actual SQL command that was executed by Entity Framework Core, as well as the db.name.
Also, what we now see are 2 spans created for our request to /WeatherForecast/Countries, one is our SQL client span and the other is the HTTP request we previously configured. If we look at the Activity.TraceId property for both, we see they are the same value. This helps us to correlate related spans for a single request.
Monitoring and Analyzing Traces Using Jaeger
So far, all our traces are exported to a console window which is not easy to read and visualize especially if we have a large application that is producing a lot of telemetry data. OpenTelemetry lets you export the data it collects to any backend of your choice such as Jaeger, Prometheus, Grafana, etc. which provides powerful dashboards and features to view telemetry data. In this article, I will show you how to install, run, and configure Jaeger to monitor our application traces.
The easiest way to install and run Jaeger is to install Docker Desktop and then run the following command.
docker run -d --name jaeger -p 16686:16686 -p 6831:6831/udp jaegertracing/all-in-one:1.21
We need to open two ports to our container. First, 16686 is the frontend UI that we will use to view our traces. The other port, 6831/udp is a UDP port that will allow Jaeger to accept jaeger.thrift traces over the compact thrift protocol.
Next, we need to install OpenTelemetry.Exporter.Jaeger Nuget package and configure Jaeger exporter in Program.cs file as follows.
builder.Services.AddOpenTelemetry()
    .WithTracing(traceBuilder =>
    {
        traceBuilder
            .SetResourceBuilder(ResourceBuilder.CreateDefault().AddService("MyAspNetCoreApi"))
            .AddAspNetCoreInstrumentation()
            .AddHttpClientInstrumentation()
            .AddSqlClientInstrumentation()
            .AddConsoleExporter()
            .AddJaegerExporter(options =>
            {
                options.AgentHost = "localhost";
                options.AgentPort = 6831;
            });
    });
Let’s run our application again and make a request to /WeatherForecast/Countries. This time, instead of looking at the console output for our traces, we’ll navigate to http://localhost:16686, which will show the following Jaeger interface:
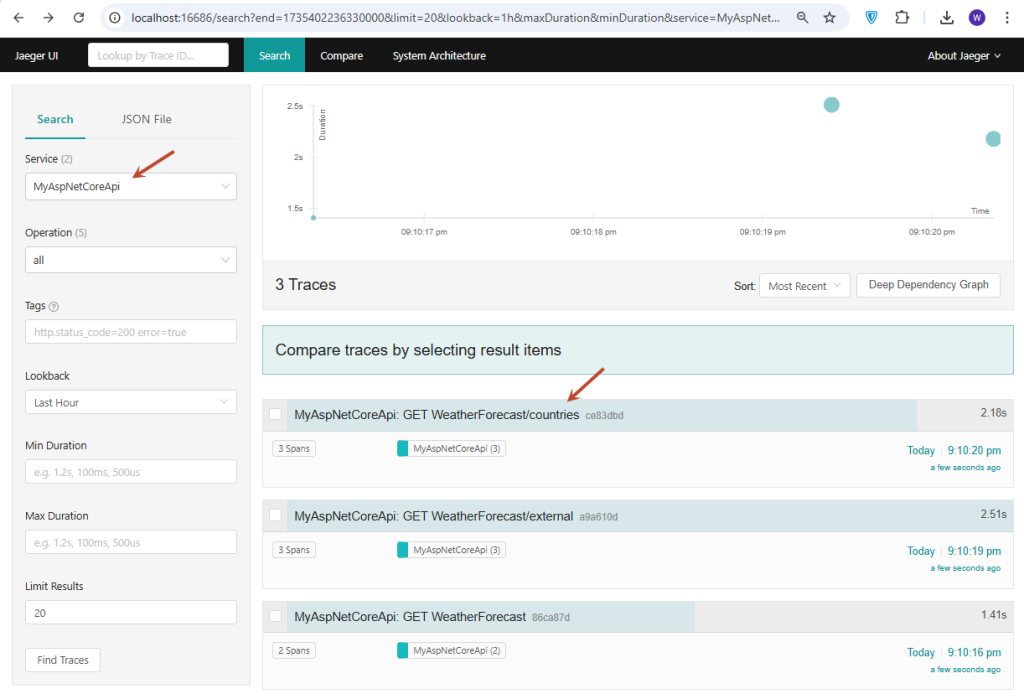
If you select our service MyAspCoreApi, you will see traces of all API requests. We can click on this trace to get more details about each span that makes up this trace:
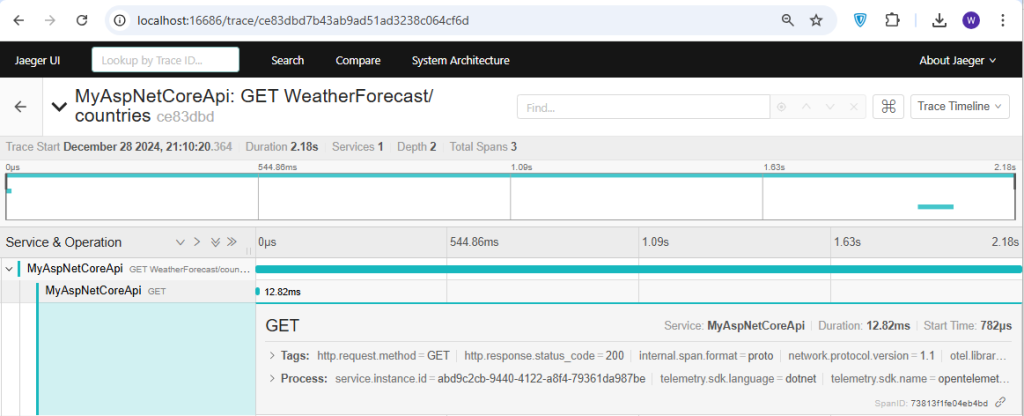
Jaeger handles the visualization of associated spans, based on the TraceId that we saw earlier. We see both the HTTP request to /WeatherForecast/Countries and the SQL client connection to our database MyDatabase, along with the duration of each activity and the overall time for the trace.
Conclusion
Distributed tracing is a cornerstone of observability in distributed systems, ensuring you have the tools to maintain smooth, efficient operations across your entire application stack. OpenTelemetry is the backbone for implementing observability in modern applications, offering a unified approach to collecting and analyzing telemetry data. By leveraging OpenTelemetry in ASP.NET Core applications, developers can gain actionable insights, optimize performance, and ensure reliability, setting a strong foundation for scaling and future-proofing their systems.

